In any thermodynamic system, including nanosystems, the free energy change during sorption is related to its internal stressing. However, experimental evidences of energy flow between thermodynamic states before and after sorption of a small number of molecules in nanosystems are rare, due to the minute energy flow and sub-nm strain variation.
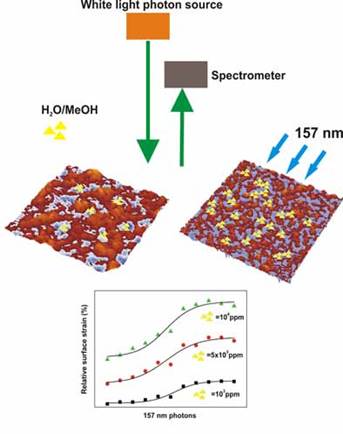
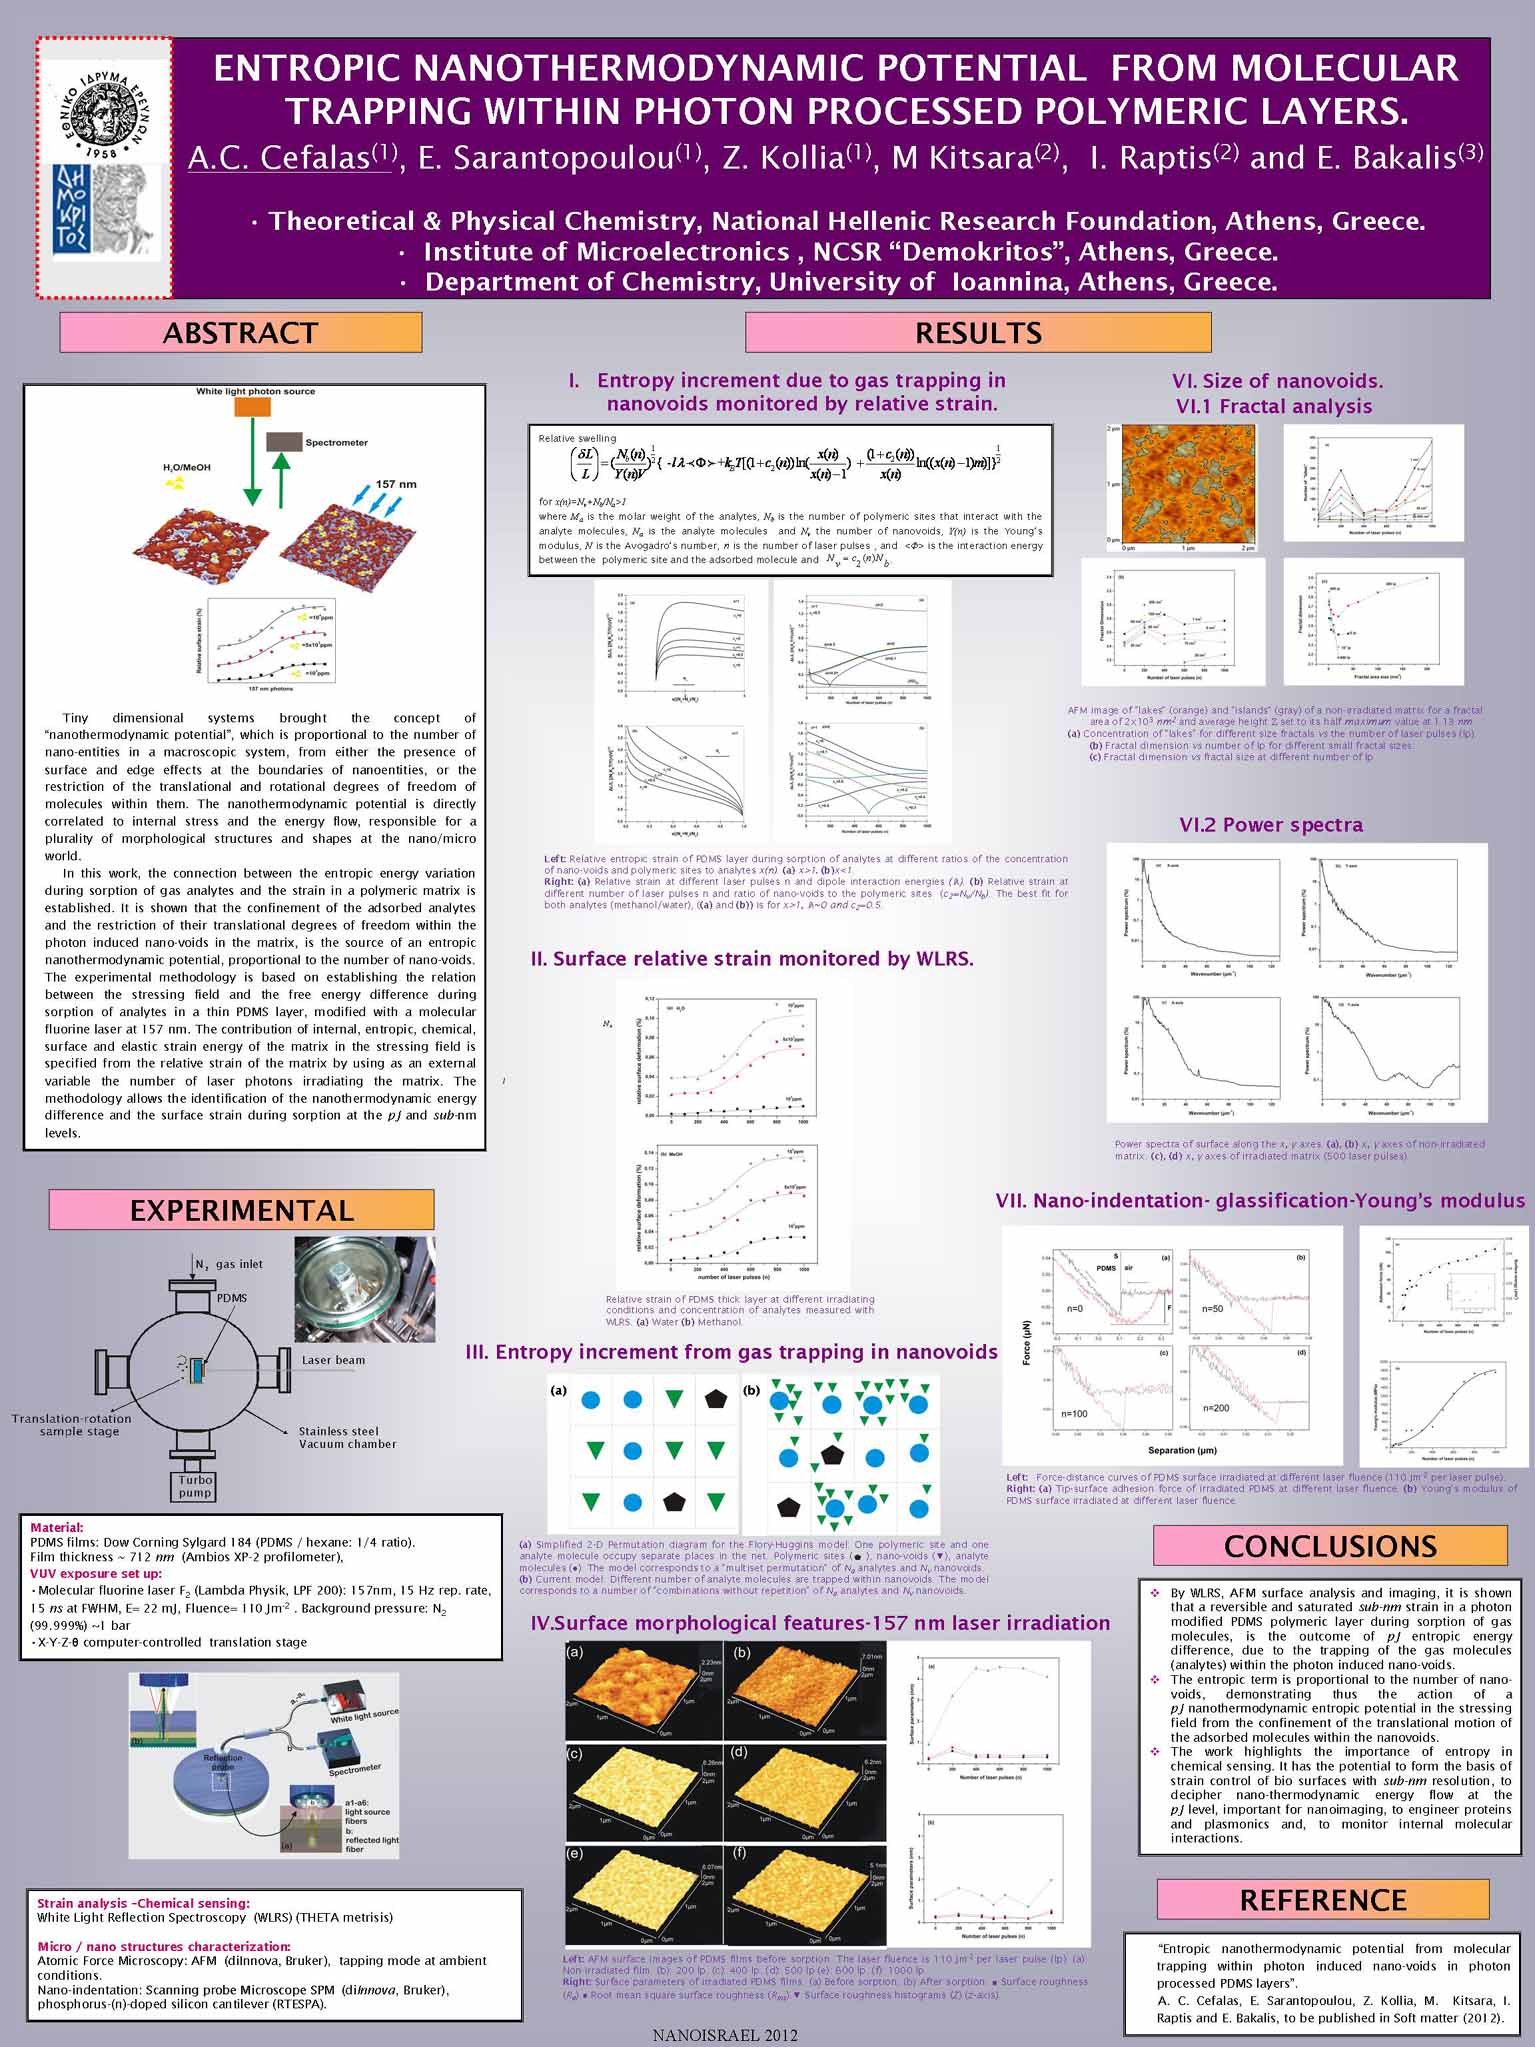
In this work, it is shown that the entropic variation during isothermal and isobaric sorption of gaseous (water or methanol) molecules in an ensemble of photon induced nano-voids within a PDMS matrix, is proportional to the number of nano-voids and the entropic nanothermodynamic potential is the outcome of the confinement of translational motion of the adsorbed molecules within the nano-voids. Following irradiation of PDMS with a molecular fluorine laser at 157 nm, white light reflectance spectroscopy establishes the relation between the entropic variation, via the sub-nm strain field, and the external parameters (number of photons and adsorbed molecules). Moreover, the contribution of entropic, internal, chemical and surface energy components in the stressing field is analyzed by nanoindentation and atomic force microscopy.
The methodology allows the identification of nanothermodynamic potentials and strain field variations in thin polymeric layers at pJ and sub-nm levels.
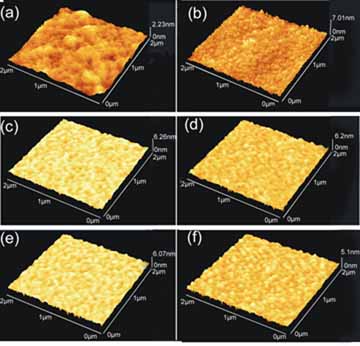
AFM surface images of PDMS films before sorption. The laser fluence is per laser pulse.
(a): Non-irradiated film. (b): 200 laser pulses (lp). (c): 400 lp. (d): 500 lp (e): 600 lp. (f): 1000 lp.
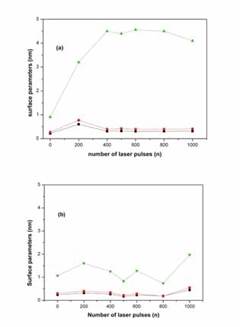
Surface parameters of irradiated PDMS films. (a) Before sorption. (b) After sorption.
(Black plot) Surface roughness (Ra).
(Red plot) Root mean square surface roughness ( Rms).
(Green plot) Surface roughness histograms (Z) (z-axis).
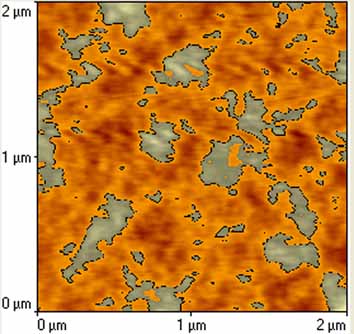
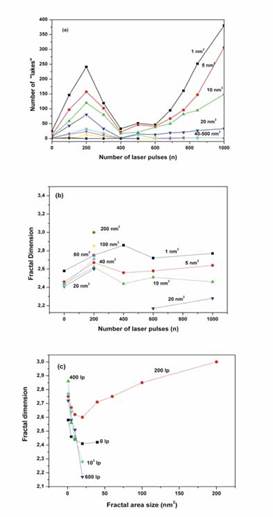
AFM image of "lakes" (orange) and "islands" (gray) of a non-irradiated matrix for a fractal area of 2X 10³ nmXnm and average height Z set to its half maximum value at 1.13 nm.
(a) Concentration of "lakes" for different size fractals vs the number of laser pulses.
(b) Fractal dimension vs number of laser pulses for different small fractal sizes. The concentration of small size nano-voids is increasing following VUV irradiation.
(c) Fractal dimension vs fractal size at different number of laser pulses.
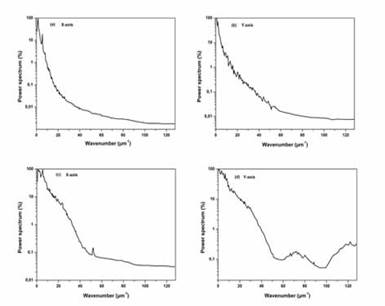
(a) Power spectra of surface along the axes. The origin of the anisotropy is attributed to the polarized laser beam that directs the dissociated moieties along a preferable direction. (a), (b) axes of non-irradiated matrix. (c),(d) axes of irradiated matrix (500 laser pulses).
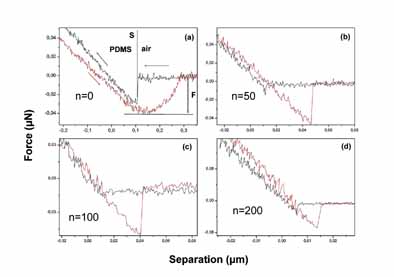
Force-distance curves of PDMS surface irradiated at different laser fluence
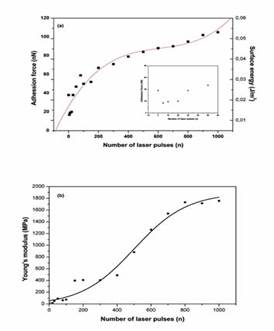
(a) Tip-surface adhesion force of irradiated PDMS at different laser fluence (per laser pulse).
(b) Young's modulus of PDMS surface irradiated at different laser fluence (per laser pulse).
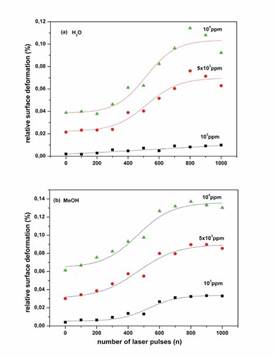
Relative strain of the 712 nm PDMS thick layer at different irradiating conditions and concentration of analytes measured with WLRS.
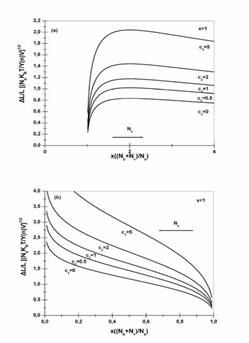
(a) Water (b) Methanol. Left: Relative entropic strain of PDMS layer during sorption of analytes at different ratios of the concentration of nano-voids and polymeric sites to analytes x(n).
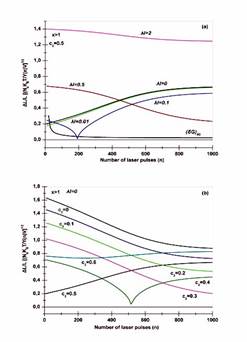
(a) x>1 (b) x<1The experimental configuration corresponds to x>1. Right: (a) Relative strain at different laser pulses and dipole interaction energies. The best fit for both analytes (methanol/water), is for x>1.
(b) Relative strain at different number of laser pulses and ratio of nano-voids to the polymeric sites. The best fit for both analytes is for x>1.
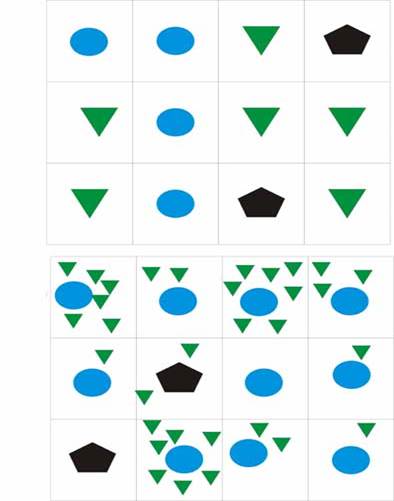
(a) Simplified 2-D Permutation diagram for the Flory-Huggins model: One polymeric site and one analyte molecule occupy separate places in the net. Polymeric sites ( ), nano-voids ( ), analyte molecules ( ). The model corresponds to a "multiset permutation" of Na analytes and Nv nano-voids.
(b) Current model: A different number of analyte molecules are trapped within nano-voids. The model corresponds to a number of "combinations without repetition" of analytes and nano-voids. In the case of strong polar interactions, the motion of analytes is restricted by the polymeric sites too.
Relevant Publications
Entropic nanothermodynamic potential from molecular trapping within photon induced nano-voids in photon processed PDMS layers.
A. C. Cefalas, E. Sarantopoulou, Z. Kollia, M. Kitsara, I. Raptis and E. Bakalis,
Soft Matter 8, 5561 (2012). DOI:10.1039/C2SM07141J

